Stanford Cleantech Hackathon 2026: the best validation needed no new data
Four of the 19 projects at the Stanford Cleantech Hackathon tested their models without collecting a single new data point: they rotated the wind 180°, switched off a weather station and predicted it, held out whole regions, or froze a rule before the test storm. That was the best engineering of the weekend. The best business advice came from the investor panel, which called “we sell to utilities” red flag number one and then named the one way around it. We built Crew Air there and did not make the finals; why is at the end.
The short version
- Validate with the data you already have. FlareWise found NO2 at 4.8 ppb downwind of a flare against 2.2 upwind, and the gap vanished when every wind direction was rotated 180°. The Chill Factor switched off weather stations and predicted each one as an orchard.
- Don’t sell to utilities, sell against a liability. A regulated utility has no budget line for a pilot to graduate into. Fire mitigation is the exception: about 10% of a utility’s infrastructure causes over half of its wildfires, and that risk has its own budget.
- Read the Devpost page, not the pitch. 13.7% in a simulator became “around 13%” if every AI inference company adopted it; a kappa of 0.78 became “almost 90% agreement”. The pages were more careful than the stage.
- Nobody had a data moat. Everyone used the same public stack: Open-Meteo, FIRMS, AirNow, CAISO, NWS, EAGLE-I, Earth Engine. The number each team was missing was utility data or labels, never a model.
- AI did the reading, physics did the deciding. LLMs read 50 plan PDFs and county agendas; routing, battery sizing, plumes and our NowCast were deterministic. The panel asked for exactly that.
Scorecard
My read of each project from its page and pitch. Strong is what I would copy; unproven is what the page does not yet show.
- FlareWise. Strong: the deepest pipeline in the room (DBSCAN sites, Gaussian plume on ERA5, a thousand Monte Carlo draws into a mixed-integer program), the 180° wind test, and an uncomfortable finding published. Unproven: the headline (19 of 1,574 sites pay for capture) is one basin at one gas price.
- Griddy. Strong: models scored on held-out regions and unseen years, beating a baseline (8.7% against 11.2% error). Unproven: the siting AUC, which the page itself says easy negatives flatter.
- Shadow Plan. Strong: delays counted by two independent programs with a test that they agree, and an LLM that only turns county pages into events with a quote and a page. Unproven: the land rebuild misses the state workbook by more than 5% at 20 of 76 substations.
- The Chill Factor. Strong: leave-one-station-out validation, and a sensor design that sends one message a day. Unproven: no orchard hardware yet.
- Pismo. Strong: the rule was set on earlier months and frozen before the test storm; it fired 27 hours before the warning in Humboldt, and Santa Cruz and San Mateo got no NWS warning at all, so a warning-driven battery would never have charged there. Unproven: one storm, county-average weather predicted outages only weakly on the training months, and outage records cover about 1 day in 7.
- USC heat and cold plan audit. Strong: a blind coder that must quote the page or say “not stated”, with agreement reported per field. Weak: kappa 0.38 on status, and the stage rounded the whole thing up to “almost 90%”.
- Dengai. Strong: deterministic routing in 30 seconds on one laptop, no paid APIs. Unproven: the 200 sites are synthetic and roads are straight lines × 1.3, though the pitch said “real streets”.
- GridLight. Strong: price against carbon hour by hour from real CAISO files, all in the browser. Unproven: the “$62 a month, 18% less CO2” home is simulated.
- WattNext. Strong: confidence as data, decaying per source. Unproven: the 360 households are synthetic, and the customer is an aggregator, close to the panel’s first red flag.
- ResilienceOS. Strong: the best opening it did not lead with, an $8 million fine for missed notice to critical facilities (a stage claim I have not checked). Unproven: its own accuracy (the 52% on stage was another paper’s) and its sites, which are synthetic.
- Follow The Sun. Unproven: 13.7% less energy comes from modeled estimates and grew on stage.
- Consumer apps. matcha keeps AI to the wording and sizes batteries in plain TypeScript, the right split. Housemates runs on simulated prices; Judy’s “reinforcement learning” is a claim on the page.
- Crew Air (ours). Strong: rules as data per jurisdiction, the NowCast instead of a lagging 24-hour mean, ML in one place only. Weak: the sky-photo check is scored on 12 photos, which is a smoke test, not an evaluation, and on stage a hardware concept took the Q&A from the software.
Who built what
Grid
GridLight. On PG&E’s E-TOU-C every hour outside 4 to 9 pm costs the same, yet 1 pm and 4 am both cost 29¢/kWh at 141 against 324 g/kWh of CO2. Data: CAISO Today’s Outlook CO2 and demand files, PG&E tariffs, SVCE’s hourly CalFUSE prices via the GridX API, the customer’s Green Button CSV. Method: intensity = Σ CO2 (t/h, imports in, exports out) ÷ demand (MW) × 1000 = g/kWh, and a planner that minimises bill plus carbon at $100/t. Vanilla JS and hand-built SVG, all in the browser, Playwright tests. Simulated: the EV home behind “$62 a month, 18% less CO2”.
Griddy. Click a California site, get a 0 to 100 build score and an hourly simulation of 2024. Five people, FastAPI and Next.js, a dozen public datasets (EIA, CAISO, LBNL, NREL ATB, EPA, Census, Earth Engine). Two chained XGBoost models: hourly demand for 7 load regions (8.7% error on unseen 2025-26 data against 11.2% for a baseline), then a siting model over 16,393 cells of 5 km, at 0.92 to 0.96 ROC-AUC on held-out regions. A linear program places the capacity. The page admits the AUC is flattered by easy negatives and shows that next to the number.
Shadow Plan. California’s plan puts 34,722 MW of solar and about 9,300 MW of batteries at 77 substations by 2036. Shadow Plan checks it against CAISO’s upgrade delays, the interconnection queue and county decisions in agendas and scanned PDFs (Tesseract). Land is rebuilt from CEC map layers and matches the state workbook within 5% at 56 of 76 substations. Delays are counted by two separate programs, Python and TypeScript, and a test checks they agree. An LLM turns a changed county page into an event with a quote and a page number. Finding: after San Bernardino’s 2019 ban, only about 190 of the 300 MW planned at Lugo fit on the land left.
Follow The Sun. A Next.js simulator that routes an inference query to the datacenter with the lowest energy use within a latency limit, from hardware efficiency, cooling weather and the local demand curve. It claims 13.7% less energy at under 100 ms, from modeled estimates.
WattNext. Household scores for a community choice aggregator: grid value, outage exposure, support need, data confidence. Real layers: Census ACS, CPUC fire tiers, OpenStreetMap, Open-Meteo, Earth Engine (NAIP at 0.6 m, Sentinel-2), Planet, Google’s Solar API. The 360 households are synthetic, seeded on real building footprints. The best idea is confidence as data: a permit starts at 85%, imagery at 70%, Green Button at 90%, a device found by the customer’s app at 97%, and each halves every equipment half-life. LightGBM on a physics baseline forecasts load 48 hours ahead; a Raspberry Pi plays a home battery.
Consumer apps. Housemates (appliance photo plus label OCR, then a chat character) runs on simulated prices. Judy pairs smart plugs with what its page calls reinforcement learning. Matcha, built solo in Lovable, keeps AI to the wording and sizes backup batteries in plain TypeScript.
Resilience
ResilienceOS. Storm-outage risk for critical facilities in SCE territory (on stage: hospitals, which utilities must warn 48 to 72 hours ahead), from ORNL EAGLE-I outage records and NOAA HRRR. Features come from NVIDIA StormCast, a regional AI weather model, fine-tuned on outage history. An LLM agent drafts an action plan that a utility employee reviews. The 52% error on stage belongs to existing models in a 2026 paper. Their own accuracy is not reported; customer sites are synthetic.
Pismo. Charge a home battery before the NWS warning. NOAA GFS through Earth Engine averaged by county, the NWS alert archive from Iowa Mesonet, EAGLE-I for 2018-21. The rule (rain ≥ 15 mm or wind ≥ 18 m/s) was set on two earlier months and left untouched for the test storm. In Humboldt it fired 27 hours before the High Wind Warning. Santa Cruz and San Mateo got no warning at all. Limits stated: one storm, and EAGLE-I fully records only about 1 day in 7.
Climate and health
FlareWise. Which gas flares to capture on a budget, counting gas value and people downwind. The deepest pipeline in the room. FIRMS VIIRS detections, matched to the Nightfire catalogue, are clustered into sites with DBSCAN. A Gaussian mixture separates routine from occasional flares. Fire radiative power becomes gas volume, an Arps decline and an NPV. An hourly Gaussian plume on ERA5 wind with Briggs dispersion lands on a Census population grid. A thousand Monte Carlo draws feed a mixed-integer program that traces the value-versus-people frontier. In the Eagle Ford, 19 of 1,574 sites pay for capture at $2.50/MMBtu.
The Chill Factor (UC Davis). Chill hours per orchard, because growers rely on a CIMIS station up to 50 km away. Data: CIMIS hourly, FNRIC sensors, PRISM, Daymet, NWS National Blend, 16-day forecasts. It rebuilds hourly temperature from daily highs and lows, so a cheap orchard sensor sends one message a day. Python with LightGBM, FastAPI on Cloud Run, Next.js. Asked how they validate without hardware, they said: switch off stations and predict each as an orchard, the night’s best answer to a judge.
Dengai. Drone-detected mosquito breeding sites in Makassar become tomorrow’s inspection routes. Priority = type × confidence × people nearby × cluster × rain, within 100 m, about the flight range of Aedes aegypti. Routing is a team orienteering problem in Google OR-Tools, guided local search capped at 30 seconds, straight-line distance × 1.3 for roads. No LLM, no paid APIs, one laptop. The 200 sites are synthetic because the lab’s real detections were not released in time.
US Heat and Cold Plan Audit (USC). A blind Claude coder answered a fixed codebook for 50 plan PDFs, each answer with a verbatim quote and page, or “not stated”. Harm comes from EpiNOAA temperatures, EPA CIRA curves and CDC WONDER. Deaths averted are Σ D_t (1 − Π (1 − r_i,t)), so measures are not double counted. A lint test fails if a place name appears in engine code. Agreement: kappa 0.78 on action class, 0.84 on commitment strength, 0.38 on status, all three on the page.
Ours: Crew Air
Try it: airsignal.app/crew (site and API, free) · Code: github.com/fortunto2/stanford-cleantech-2026 · Devpost: devpost.com/software/crew-air
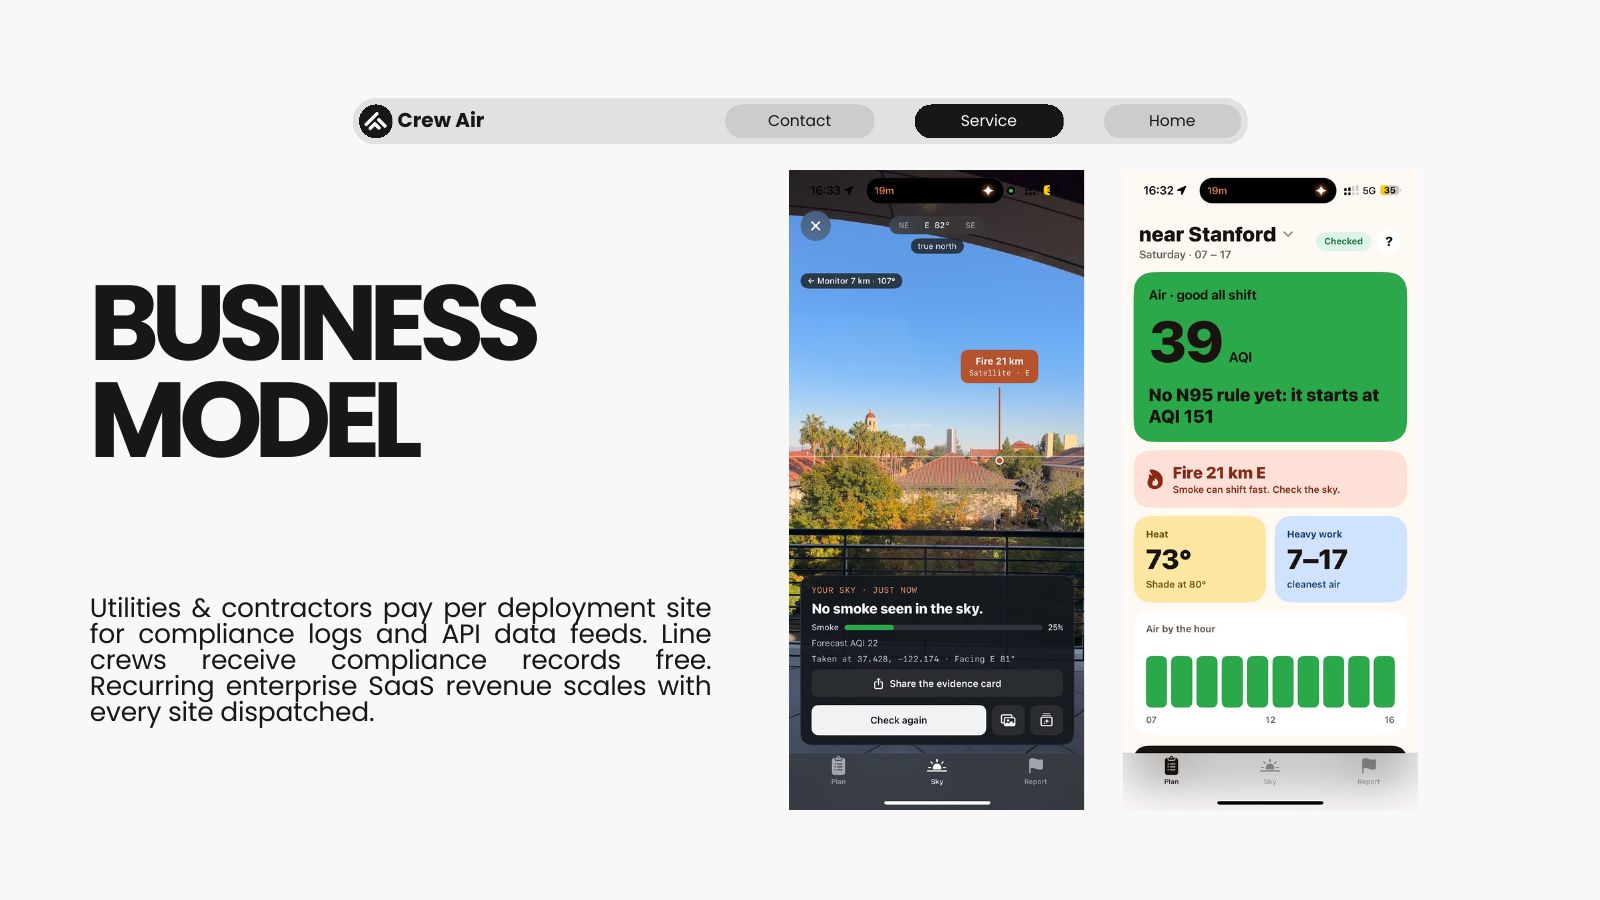
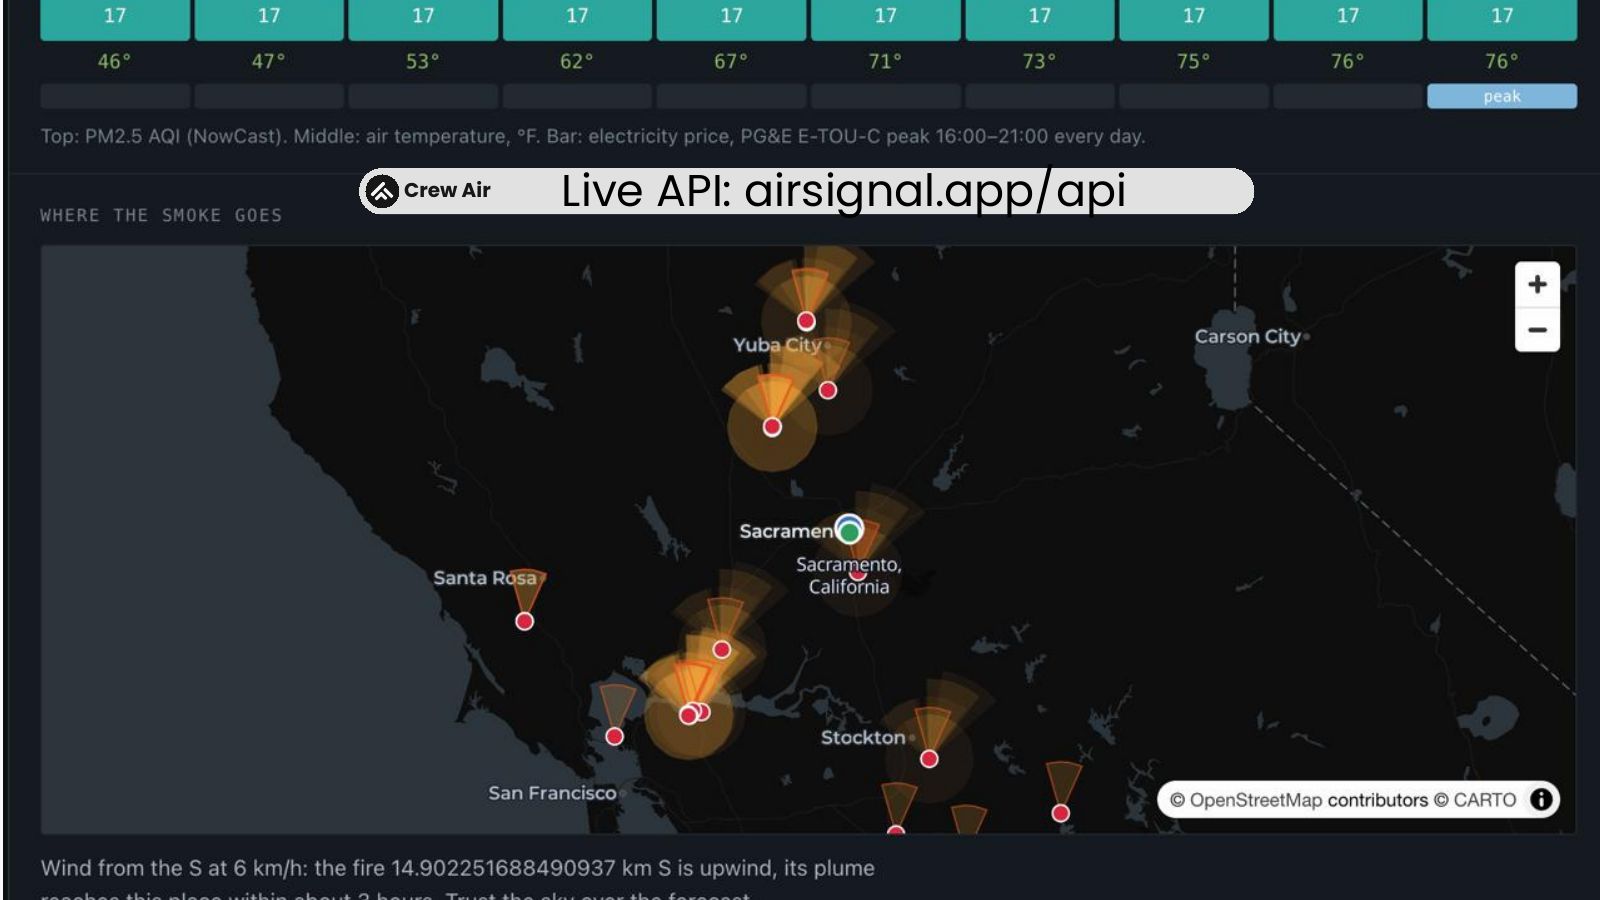
The hour each Cal/OSHA rule starts on an outdoor shift. Rust engine (airq-core) compiled to WASM on a Cloudflare Worker, D1 for reports. It computes the EPA NowCast from hourly PM2.5 (why is in the API notes below). Rules are data: one JSON rulebook per jurisdiction. VIIRS fires within 50 km raise a warning. An AirNow monitor within 25 km that disagrees by more than 1.5× scales the forecast, clamped to [0.5, 3] and fading over 12 hours. Hourly wind draws smoke cones, with NWS as fallback. A sky photo goes to TypeSafe’s Jev: smoke right on 11 or 12 of 12 known photos, never wrong. ML appears only there.
The finals: pitches and the judges’ questions
Judging was split evenly over four criteria, announced at the opening: fit to a track’s challenge, creativity, technical feasibility, and a path to scale (workshop recording, 37:41). The finalist recording has eight pitches, from Follow The Sun to ResilienceOS, and stops in the last Q&A.
Jump to a pitch: Follow The Sun · Housemates · Judy · Dengai · USC heat and cold plan audit · The Chill Factor · matcha · ResilienceOS.
The judges asked about money and moats more than about models (times below are in the finals recording):
- Follow The Sun: what happens to GPU memory across a chain of prompts? Pin the chain to one datacenter for about an hour, which covers “99% of cases”. And who decides where a prompt runs? Whoever hosts the model (05:04).
- Housemates: Opower’s most successful move was comparing a home with its neighbours; would the app do that? Their answer: rankings by cost and carbon saved (11:59).
- The Chill Factor: does this make farmers competitors or collaborators? Their answer: free public data first, light hardware later as a data flywheel. Pistachio yield fell 47% in 2015.
- ResilienceOS: what makes the data proprietary, and do better storm forecasts serve insurers or power producers? The answer stayed general.
- matcha, on revenue: “B2C2B”, featured vendors and sign-ups for virtual power plants.
- Numbers said on stage: Dengai, 544 dengue deaths in Indonesia in 2025 out of 131,000 confirmed cases; USC, 1,061 more lives saved in LA County for the same budget; Judy, a $5 plug saving $185 a year.
What the investor panel said
Three investors: Kevin Kopczynski of Congruent Ventures (pre-seed to Series A, a $275M third fund), Ajay Gupta (climate and AI), and Giancarlo of a Swiss carbon fund that began as a family office.
What a builder can use, with the time in the full recording:
- Data is not the product. “They’re not in love with the data, they’re in love with the application” (Kevin, 14:52). Methane satellites are a public good, not a business. First Street went from a nonprofit to selling to insurers and asset owners, and was acquired in a few years (on stage “Moody’s”; the buyer, in June 2026, was MSCI).
- Join a decision someone already makes: whether to connect a load to the grid, whether to store or dispatch (Ajay, 16:32). “People are not willing to pay a green premium. That is a known fact now” (17:42).
- Take risk only on the core. “You should be buying every other damn thing possible… it’s about speed” (Kevin, 21:24). His own story: an anti-reflective coating now on every First Solar panel, 150 square miles of glass.
- The first 30 days. Talk to a hundred potential customers in a few weeks and find who buys and who decides (Ajay, 24:28). Pick a customer for whom failure has severe consequences, and look for the job they hire you for: a diligence tool may really sell “a layer of security for their decisions” (Giancarlo, 22:44).
- Grants are good when they make you faster and bad as “a way to stay alive and extend your runway indefinitely” (Giancarlo, 39:15). Lobbying comes at scale: Fervo fought drilling rules stricter than oil and gas had. “We got a lobbyist” at the seed stage is a red flag (Kevin, 41:36).
- Adaptation already has products: Adaptive Insurance covers deductibles on wind, hail and wildfire, FutureProof sells where people lost their insurance, Florida first and now California. Home hardening is underfunded.
- Data centers. Kevin: half to two-thirds of GDP growth is tied to them. A castings company he knows now makes heat sinks for them (44:14).
- Hardware vs software. “Software companies take less money or less time is a fallacy”, and in climate “the bigger returns come from hardware” (Kevin, 51:50). Giancarlo on why funds care about speed: “IRR is very sensitive to time” (50:53). He spelled out the math every investor runs during a pitch: a fund owns 5 to 20% of each company and only a few of them must return the whole fund, so the question is “is your company one of the few that can return the fund? And if yes, when?” (51:13).
Red flags, and the one way around them
The red flags were explicit, and they came from three people. Kevin Kopczynski (Congruent Ventures) gave the first two (27:55). Number one: “we sell to utilities”. A utility earns a regulated return on approved capital; a pilot paid from its R&D line has no bucket to graduate into, and the panel would not back a first-time founder who wants to sell to utilities: “there are better places to bang your head against the wall” (31:17). Asked about the ones that made it, he said even a company “killing it” with one utility often cannot repeat it at the next with the same product and playbook. His only explanation was a champion found inside an opaque decision process: “I don’t know the answer to that question, otherwise I might have changed my answer” (45:20). Aaron Levie said something close about enterprise AI two weeks earlier: adoption tracks one AI-pilled person inside, not the size of the company (aaron-levie-agi-house-2026).
Number two: subsidy as the business. He later narrowed it: SBIR, STTR and DOE grants have a role, a solution that only works while subsidised does not. Ajay Gupta added AI used where physics or an optimizer would do (26:20). Giancarlo added single-digit total addressable markets and hardware that scales by more than 10× per step: “it’s basically not going to happen”. His tell is a deck that goes from 1,000 tons a year to 50,000 three years later, a 50× step that says the team has not scaled hardware before (30:30). ResilienceOS and WattNext still pitched a utility or an aggregator as the customer.
There is one exception, and Ajay named it: sell against a liability that already has its own budget line. About 10% of a utility’s infrastructure causes over half of its wildfires, and fire mitigation is a line item a startup can sell into (46:09). ResilienceOS had the start of that argument. On stage it said SCE was fined $8 million for missing the 48 to 72 hours of notice it owes critical facilities (finals recording, 44:48; a stage claim I have not checked). My reading: the fine was the budget line, and a stronger opening than the model.
What to expect in this industry
The money follows data-center load. A panelist said demand growth is the fastest since right after World War II. Hyperscalers buy transformers and switchgear directly, outside the utility process. Four projects worked that seam: Griddy sized a 1 GW AI campus, Follow The Sun routes inference, WattNext sets a campus against substation headroom, Shadow Plan tracks the queue. LBNL, cited by Griddy, finds only about 13% of capacity that asks for a connection reaches operation. My inference: siting and interconnection intelligence is where software meets that money, and the buyer is a developer or a hyperscaler.
Adaptation is the white space, and asset owners pay. Paraphrasing the panel: funding adaptation used to sound defeatist, and it is now clear mitigation alone is not happening. They named extreme-weather risk, insurance, asset owners with billions at risk, and home hardening. Pismo, ResilienceOS, the Chill Factor (pitched to lenders and land buyers too) and Crew Air sit there.
Patterns becoming standard, my inference from the 19 projects:
- One shared public stack: Open-Meteo, FIRMS, AirNow, CAISO, NWS, EAGLE-I, Earth Engine, Census. Nobody had a data moat.
- Downscaling a coarse source to a point: orchard from station, work site from monitor, county from a GFS grid.
- Tools inside a decision someone already makes: a capture budget, tomorrow’s routes, a comment to the CPUC.
- LLMs for reading documents, deterministic code or classic ML for anything physical.
Overhyped, in my reading: chat over a dataset (a panelist: build for the questions businesses actually ask), consumer apps on simulated prices, and “AI” as a label on a rule.
Seven insights
- The best validation needed no new data. FlareWise rotated every wind direction 180°: NO2 at Karnes was 4.8 ppb downwind against 2.2 upwind, and the signal vanished under rotation. The Chill Factor and Griddy held out stations and regions.
- Price and carbon disagree, and the usual advice follows price. On GridLight’s simulated home, the same $62 saving cuts CO2 18% at midday and raises it 7% on an overnight timer.
- Provenance became a feature. WattNext decays confidence per source. Griddy labels every number observed, assumed, simulated or inferred. ResilienceOS counts separating real from synthetic as an accomplishment.
- The honest finding was the uncomfortable one. FlareWise found that capturing the cheapest gas first avoids more greenhouse gas than its health plan, and published it.
- Numbers grew between page and stage. 13.7% in a simulator became “around 13%” saved “if all AI inference companies” adopted it, on a premise that off-peak hours run “solely on renewable energy”. A kappa of 0.78 became “almost 90% agreement”. Dengai’s routes ran “on real streets” in the pitch and on straight lines × 1.3 in the Q&A. The pages were more careful than the pitches.
- The missing number is never a model. Utilities do not publish spare substation capacity (Griddy). EAGLE-I gaps make “no outage” unconfirmable (Pismo, ResilienceOS). Dengai’s real detections were not released. Labels and utility data are the bottleneck.
- The panel’s AI rule matched the best builds. Dengai’s routing, matcha’s sizing, FlareWise’s plume and our NowCast are deterministic. LLMs did the reading: 50 plan PDFs, county agendas. A mentor asked me “what is your model?”, and “rules and physics” was the right answer.
Notes on the APIs, for whoever builds on them next
Each public API we used had one trap. What it gives, the trap, the fix:
- Open-Meteo air quality. Hourly PM2.5 and weather, no key. Trap:
us_aqi_pm2_5is a 24-hour mean, which lags a smoke front by most of a shift. Fix: compute the EPA NowCast from hourlypm2_5. - Open-Meteo, from a Cloudflare Worker. Trap: a 429 “Daily API request limit exceeded” for the whole UTC day, because the limit is per IP and Worker egress IPs are shared. Fix: fall back to the nearest AirNow reading and NWS temperatures, say so in the answer, and put the upstream status in every error. It is also free only for non-commercial use.
- The AQI scale. Trap: it stops at 500, so a rule written as
AQI >= 501never fires. Fix: write smoke thresholds as concentrations, 55.5 and 500.5 µg/m³, as Appendix A of §5141.1 does. - AirNow hourly files. Regulatory monitors, no key. Trap: the newest file fills in over the next hour, so a listed monitor can have an empty PM2.5. Fix: read files newest first, up to four hours back, and take the median of the nearest three monitors.
- NASA FIRMS. The public 24-hour VIIRS CSVs need no key; the area API needs a free MAP_KEY. Trap: VIIRS sees heat, not smoke, so flares and landfills show up as “fires”. Fix: say so on the map.
- NWS. Hourly forecast via
/points/{lat},{lon}, and active alerts by point, free. Send a User-Agent with contact details, as NWS asks. - DOL OSHA enforcement API. Free key. Traps: it refuses urllib’s default User-Agent, and it answers 403, not 429, while throttling. §5141.1 is coded
51410001, while a bare5141 Ais the older §5141. Fix: real User-Agent, slow retries, a local cache, batches of 40. - EPA AirData × BLS QCEW. Daily county AQI times farm employment (NAICS 11, × 5/7 for workdays) gave our exposure table: 4.5 million worker-days at AQI 151+ in 2020-21.
- TypeSafe Jev. Typed questions about a photo, answered with probabilities. Trap: wording changes answers. Fix: a 12-photo eval rerun after every change of wording. Smoke was reliable and visibility was not.
- Platform traps. Astro’s origin check returns 403 to a multipart POST without an Origin header, so app endpoints take JSON or raw
image/jpeg.wrangler devkeeps its edge cache across restarts, so add a throwaway query parameter. Overpass timed out from the venue twice. Devpost answered 403 to our agent’s fetcher; curl with a browser User-Agent worked.
Earth Engine
Earth Engine. We used it for the pitch, not the product. Notebook auth was blocked on our Cloud project, so a small helper passes a gcloud auth print-access-token token into ee.Initialize as OAuth credentials. We had no Planet account, so we used Sentinel-2 instead (COPERNICUS/S2_SR_HARMONIZED). The least-cloudy scene from 10 to 24 October over the largest FIRMS cluster of 20 October, near Sequoia, rendered as a SWIR composite (B12, B8A, B4), shows the active fire front. A second script computes a dNBR burn scar from median NBR before and after, thresholded at 0.27. At a hackathon its value is that a whole archive comes back as one getThumbURL PNG, with nothing downloaded.
From the opening workshop by Stace Maples (Stanford Geospatial Center), the traps worth knowing (full recording):
- Always pass
scaletoreduceRegion. Without it Earth Engine computes at the Code Editor’s current zoom, 153 m in his demo, and returns a different number. - Planet’s public Education & Research account gets 5,000 km² a month. Clip to the GeoJSON area and ask for one band: “I actually just want an NDVI… ask for one band. That’s much cheaper.”
- An order is not a download: images sit in cold storage and take about 30 minutes to come out. Use the Planet SDK rather than the raw API, whose results are paginated.
- Earth Engine, Mapbox, Planet and Google share one Z/X/Y tile grid, so layers from different sources line up;
mercantileturns a GeoJSON extent into a list of tiles. - The point of PlanetScope is the daily image, not the resolution: about 250 microsatellites image almost every place on Earth every day at 3 to 4 m, between 9 and 10 am local time (workshop recording, 21:13). “You see things one day, you can do something about them the next day.” His examples: SkySat counts of the ships queued at both ends of the Suez Canal while the Ever Given was stuck (31:47), a Stanford project that spots charcoal camps in the Amazon tied to human trafficking fast enough to intervene (33:14), and oil in storage measured from the shadows inside floating-roof tanks, which needs the sun and view angles from the image metadata (26:11).
- No Planet account: Planet publishes disaster data as cloud-optimized GeoTIFFs on plain HTTP, Earth Engine already holds SkySat samples, and the awesome-gee-community-catalog adds more. Other teams used it harder. Griddy took layers for siting, WattNext pulled NAIP at 0.6 m, Sentinel-2 and ESA WorldCover, and Pismo read NOAA GFS forecasts through it. Pismo also measured the cost: about 8 months of forecasts took 1.5 hours, so they cut scope to one storm.
What happens with Crew Air now
We did not make the finals. A hardware concept added on the last morning took the whole Q&A, and the running software never came up. The lesson fits in a line: lock the story the night before.
Crew Air stays a free tool for outdoor crews in California, with no business around it. Site and API are live at airsignal.app/crew. That evening I added two ideas from other teams: a calendar file of the shift plan (GridLight) and a deterministic backup-battery calculator (matcha).
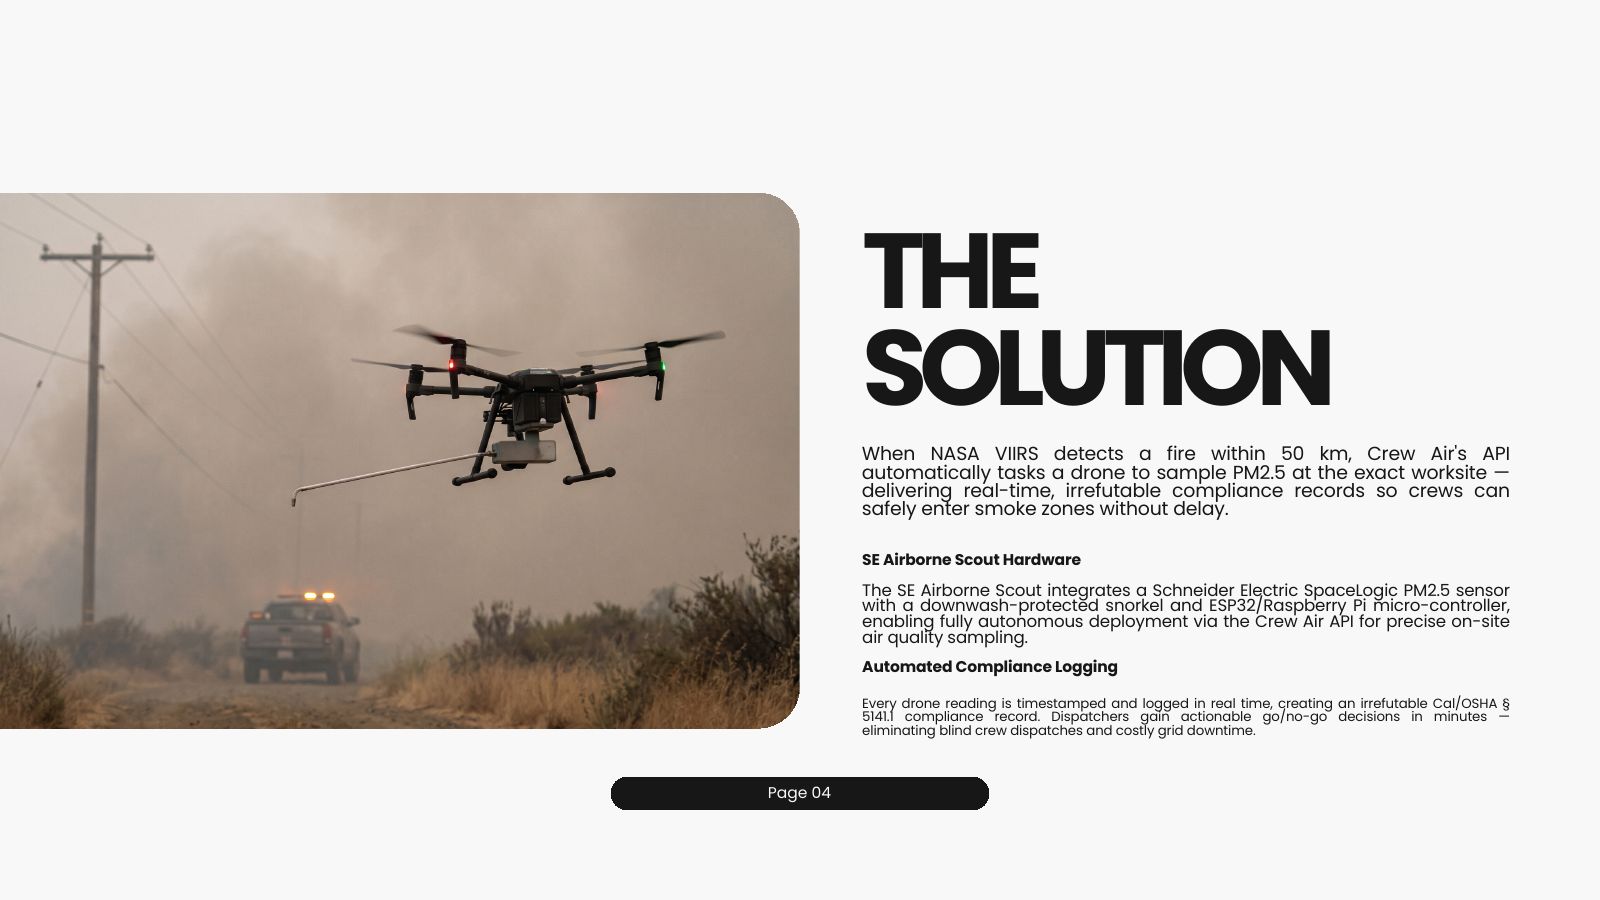
Two ideas from the event stay on the list as plans, not results. One is the drone from the deck: a Schneider Electric building air-quality sensor (SpaceLogic PM2.5) flown to the spot a crew is about to be sent to, so the reading comes from the work site and not from a monitor up to 48 km away. The other is a signal in the API that lets energy storage at stations and in buildings charge ahead of a smoke event.
- Pitch deck, 7 slides (PDF, 0.7 MB): crew-air-pitch-stanford-2026.pdf
- Devpost: devpost.com/software/crew-air
How this was put together
I spent the 24 hours building Crew Air with a teammate, so the survey came around the build. I recorded the investor panel, the finalist pitches and the Earth Engine workshop on a DJI camera and transcribed them on my laptop, ran project-supervox during mentor conversations, and read all 19 Devpost pages. Stage quotes come from corrected transcripts, with the time in the video; numbers come from the project pages unless stated. Devpost marked no winners while this was written, and the room recording stops when the judges left to deliberate.
Related: cal-hacks-13-2026 and dell-nvidia-gb10-hackathon-2026 (the next day), every event in hackathons.